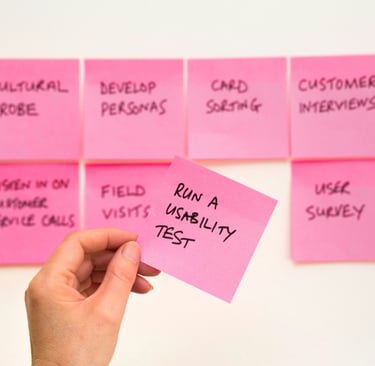
A step-by-step guide on benchmarking usability using the System Usability Scale
An easy-to-follow explanation of the SUS, how it operates, why it matters, and when to use it to measure usability effectively
USER RESEARCH
Veilworx

Usability is an essential factor in how users interact with your product; it could be a mobile app, website, or internal tool. But how do you make sure it’s effective and consistent? Simple, by using the System Usability Scale (SUS).
What is the system usability scale?
The System Usability Scale (SUS) was developed in 1986 by John Brooke at Digital Equipment Corporation as a means to quickly assess the usability of systems. Although it has been in existence for some time, the SUS remains one of the most widely used usability evaluation methods across various industries today.
There are 10 items on the SUS questionnaire, each rated on a 5-point Likert scale ranging from Strongly Disagree (1) to Strongly Agree (5). The final SUS score ranges from 0 to 100, and a score 68 implies average usability level. Three reasons to adopt the SUS are:
The technique is simple and fast
It’s applicable to any digital product
It’s cost-effective and statistically reliable
Benefits of benchmarking usability
If you measure how usable your product or service is over time or compared to other options, these are benefits you will enjoy:
Discovering usability issues early
Validating design improvements
Tracking progress and changes
Supporting UX decisions with data
Unlike task success rate or time on task, which are specific to individual interactions, SUS measures the overall perceived usability, and it’s a core perspective when curating a product experience.
How to benchmark usability using the system usability scale
Step 1: Create the test
Clearly define the subject of your evaluation, like an onboarding flow or the complete product experience.
Source representative users (5-10 participants can yield reliable results with SUS)
Add tasks that reflect real-world scenarios, like completing a checkout
Ensure the testing environment mimics typical usage, like device type, internet conditions, and so on
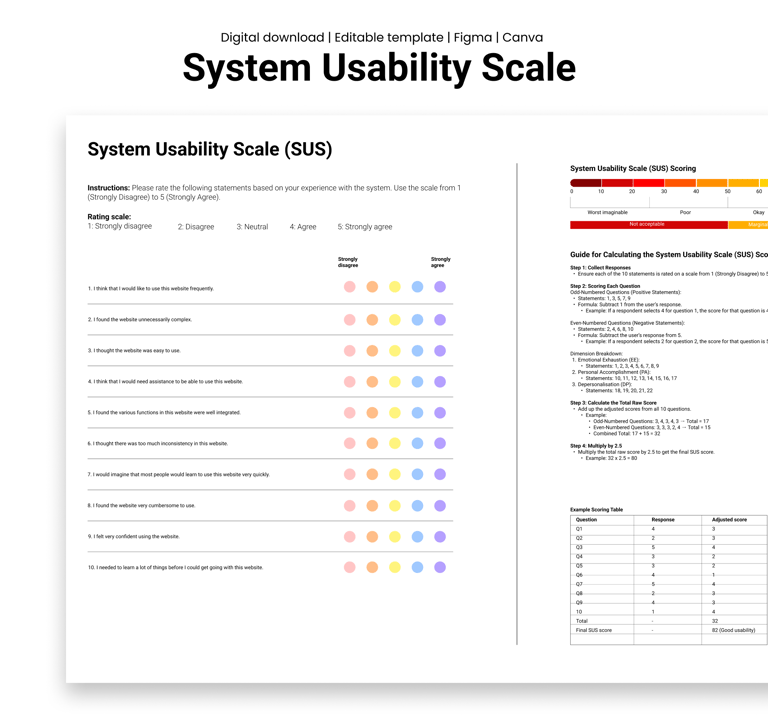
Step 2: Employ the system usability scale
After completion of tasks, ask users to fill out the SUS survey. It has these 10 statements:
1. I think that I would like to use this system frequently.
2. I found the system unnecessarily complex.
3. I thought the system was easy to use.
4. I think that I would need the support of a technical person to use this system.
5. I found the various functions in this system were well integrated.
6. I thought there was too much inconsistency in this system.
7. I would imagine that most people would learn to use this system very quickly.
8. I found the system very cumbersome to use.
9. I felt very confident using the system.
10. I needed to learn a lot of things before I could get going with this system.
Step 3: Calculate the score
Sorting scores is pretty straightforward:
For odd-numbered items, subtract 1 from the user’s response.
For even-numbered items, subtract the user’s response from 5.
Sum the adjusted scores and multiply the total by 2.5.
You should get a SUS score between 0 and 100. If a user gives mostly 4s and 5s, the score will be high, indicating better usability.
Step 4: Interpret your results
Since 68 is the average SUS score, scores above 80 are excellent and indicate strong usability, while scores below 50 suggest serious issues with usability. Design changes should be guided by the score. Assuming the SUS score improves after a design sprint, it suggests that your changes were effective. You can also benchmark against competitors if you’re testing similar flows, for instance, comparing your checkout flow to others in the same industry.
When to use system usability scale in the product development cycle
You can apply SUS throughout the development process, but other ideal moments include:
After major feature releases
During beta testing before launch
As part of regular UX health checks
During design sprints or usability reviews
You can use the SUS scores over time to identify trends and ensure every change brings real improvement.
Real-world example
Let’s say a small fintech company released a new user onboarding flow. After noticing a high drop-off rate, they decided to conduct a SUS test. Before changes, users scored the onboarding flow at 45, stating issues with clarity and easy usage. After the redesign, a second round of SUS testing showed a score of 78, an obvious improvement. The team used the system usability scale results to grade changes and present usability improvements to stakeholders, backing the importance of user-centred design.
Conclusion
Start benchmarking with SUS, it is reliable, lightweight and can disclose where your product or service may be falling short. It’s an accessible way to back design decisions with data and make user experiences significantly better.
Try our System Usability Scale today and start gathering data that supports real improvements.
Design resources that deliver results
Copyright © Veilworx Ltd 2024. All rights reserved.
Registered in England and Wales.
Company number: 15318142
Contact
Email: contact@veilworx.com
Address:
Office 9944, 182-184 High Street North East Ham London
E6 2JA
Business hours:
Monday to Saturday: 10am to 6pm
Sun: Closed